The Paradigm BI Task Visual for Power BI (PBITask) is designed to help you automate and orchestrate your work processes. It can be readily included in your existing business process to simplify and accelerate your workflow.
Business Intelligence is about Process, it is a service that enables the achievement of business objectives. Let us disambiguate BI from Data Science, which is more investigative, and Data presentation which speaks for itself. The core of BI is business and it is intrinsically linked to the business process. If we dig a little deeper into BI we find that one of the key requirements is often a data download, a spreadsheet. Downloading is done for a few different reasons, an important one is the transfer of information between different systems, but that is not our main concern here. One of the most important uses of spreadsheets is task management and collaboration. In the past, this was an expedient approach to adapt paper systems to new technology and printing out spreadsheets is still a common method for collaboration. However most BI consumers now have access to SAAS collaboration systems on their desktop and mobile devices, this is where the Paradigm BI Task Visual comes into play. PBI Task is intended to simplify business communications by allowing insights to be efficiently converted into tasks that are delegated, escalated, collaborated or self-referenced. Use the Task Visual to automate and reduce the latency that exists within a process flow. SAAS collaboration systems provide a variety of options for interaction via API, that is using Power Automate or similar.


ID 170592464 © Vector World | Dreamstime.com
The Paradigm BI Task Visual is designed to replace the manual processes that are used to action business intelligence insights. It does this by taking the context of a BI insight, allowing the user to input a description of the insight, and then sending a task to the appropriate collaboration channel.
The input data is a summarised fact table, in the example, it is a product table with some measures reflecting stock levels and order status. These tables are imported into PowerBI and would be refreshed on schedule. In a production environment, the measures may be better served up from a direct query fact table to offer near-real-time data. The output is the task payload which consists of:
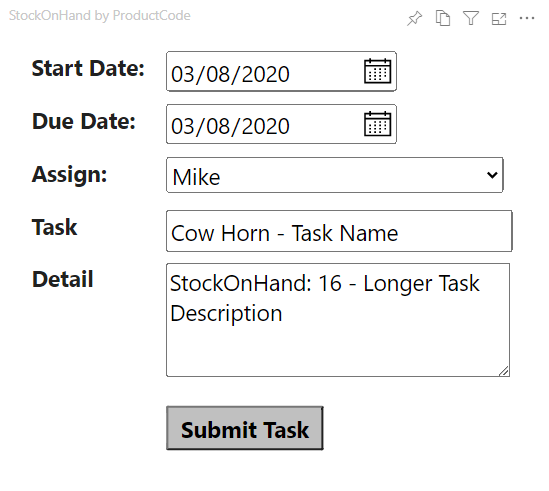
- Assign: The Person of Group That the Task will assignee to
- Task: A short task Name
- Task Description: A longer Task Description
- Start Date: Task Start Date,
- Due Date: Task Due Date,
- Category Id: This is for downstream systems a unique category identifier
- User Name: The task originator.
The 'Submit Task' button sends the payload to the target downstream process, normally a Power Automate Flow. The Flow URL is configured in the formatting pane.
Assign
This field is a drop-down list, which is populated from the StaffList which is a simple JSON format with Name and Email, the name is displayed in the drop-down, the value, the email address is used in the payload. Be aware of security issues, this is a URL that should be available to the Power Bi client. Use of Group email addresses may be beneficial to your process. There is a sample of the JSON in the repository.
Task
The task defaults to the selected category as defined in the Fields Pane, this field can be edited in the Visual and will be passed to the payload
Task Description
This defaults to the selected category followed by the measure as defined in the Fields Pane, this field is editable and will be passed to the payload
Start Date
This speaks for itself; it defaults to today and it is a date field so you can use the calendar pop up
Due Date
This again defaults to today with a calendar popup, the form of which is determined by the browser.
CategoryId
This is for the downstream process to classify the task; in our example, it could be the ProductId or the ProductTypeId. It is in the Fields Pane and does not show in the Visual, use MAX as an aggregator on the measure.
UserName
This is the logged-on user for use as the person that raised the task in the downstream process. It does not show in the Visual, it is in the Fields Pane. Normally supplied as a DAX measure (USERNAME())
Configuration
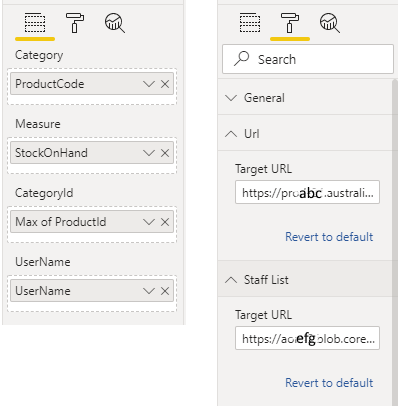
The configuration is fairly simple, add the fields to the Fields pane and the URLs to the Format pane. The Payload is sent to the first URL, which is normally a Power Automate Flow. The Staff list is loaded from the second URL.
The Downstream Process
Most of the testing for the downstream process has been done using Power Automate aka Flow. There is a Flow package in the repository that can be imported to create a new flow. Some testing has also been done with Azure functions. Testing with Zapier was discontinued due to CORS issue, this can be a problem as the Visual uses an HTTP request which has a request header origin of "*"
Testing
The visual has been tested for common scenarios in the Power BI service, it is recommended that you test yourself in your PowerBI Service.
Security Issues and Disclaimers
The visual does expose the URLs of the Staff List and the Flow, it may be beneficial to use a proxy to obfuscate this. A publicly exposed Report will work, but the username will become meaningless. This visual has been tested with Microsoft Edge and Chrome, performance in other browsers will vary and it will not work in the mobile app. The visual is not certified and does break a few rules for certified visuals. It is recommended to deploy the visual as an organisational visual. Issues can be reported through the repository.
Forward-Looking
Late in 2020, there is a planned Power Automate visual on Power BI which will be very useful for implementing Active Business intelligence, there are also upgrades to Lists and to Teams. The Paradigm BI Task Visual is intended to be at the cutting edge of integrating BI into the business process and upcoming PowerBI features.
Downloads and further information
Downloads and repository links are at the Download Page any additional enquiries use the Contact Page
There are two videos on YouTube, these feature version 1.0.0 since then the Category Id and User Name have been added
Active BI Demo https://www.youtube.com/watch?v=3_UOTRDhLRU&t=8s
How to Add a Paradigm Task Visual https://www.youtube.com/watch?v=lNhTXgpmdzk