Preamble
This is a companion piece to the video Power BI Tooltips in HTML Content explaining how it all works and what to do to make it all happen. The HTML Content Viewer is a Power BI Custom Visual from Daniel Marsh-Patrick
Make some HTML and load it
Let's look at some sample HTML, this embraces the KISS principle:
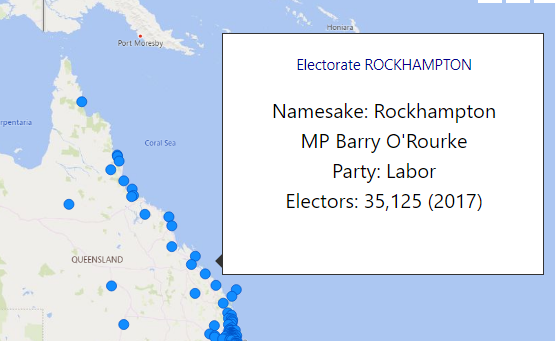
<p style='text-align: center; color: darkblue;'>Electorate {Electorate}</p>
 <p style='text-align: center; font-size: 20px;'>Namesake: {Namesake}</br>
 MP {MP}</br>
 Party: {Party}</br>
 Electors: {Electors}</br>
The important bit here is not to get fancy, use an inline style in moderation. This is just the fragment you need, edit it in the editor of your choice. We will be substituting data into the field names with the parentheses around them, that's the squiggly brackets like "{Electorate}".
Loading the HTML into PowerBI is a little tricky since it's not a web page, you'll need a blank query to get you started Home->Get data->Blank query. In the video, I have embedded the HTML in the query. Another option is to use Azure Storage and load the HTML by URL using a parameter with the URL in it. I like this because I just drag and drop HTML using the Azure Storage Explorer and hit refresh.
Here's some PowerQuery to do that:
Source = Web.BrowserContents(#"htmlUrlParam"),
 #"Converted to List" = {Source},
 #"Converted to Table" = Table.FromList(#"Converted to List", Splitter.SplitByNothing(), null, null, ExtraValues.Error),
 #"Renamed Columns" = Table.RenameColumns(#"Converted to Table",{{"Column1", "html"}})
in
 #"Renamed Columns"
You'll have to use the Advanced Editor option in the Power Query Editor to do most of this, it's fairly friendly to use but lacks any fancy features.
Here's the code for embedded HTML:
let
 Source = "<p style='text-align: center; color: darkblue;'>Electorate {Electorate}</p>
 <p style='text-align: center; font-size: 20px;'>Namesake: {Namesake}</br>
 MP {MP}</br>
 Party: {Party}</br>
 Electors: {Electors}</br>",
 #"Converted to Table" = #table(1, {{Source}}),
 #"Renamed Columns" = Table.RenameColumns(#"Converted to Table",{{"Column1", "HTML"}})
in
#"Renamed Columns"
Once you've got the code in place, let the query run to check the data. Download the HTML Content custom visual from the store and test the query with
the Visual on a Power BI page, just drop the HTML onto the "Values' field and check its appearance is satisfactory.
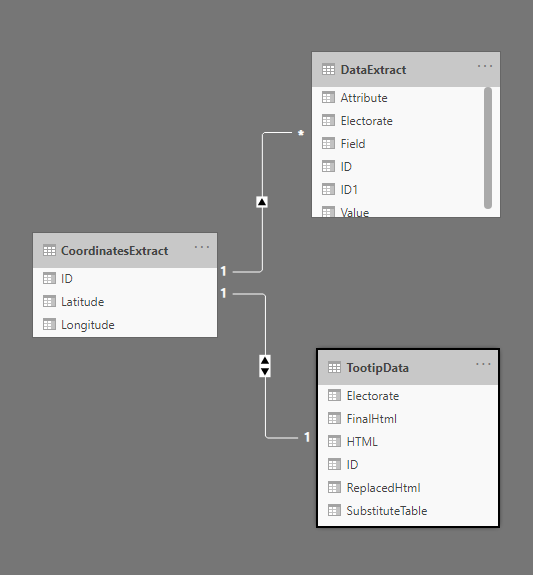
Loading Tooltip Data
The data for your tooltips must have an identifier to link it to the data presented on the main visual, which in the demo is a map visual. My example is just called "ID" and then a list of field names, the attributes in parentheses, and the value to use for substitution. In the PowerQuery ReplaceAll function I use the column names "Attribute" and "Value", note that they are capitalised, this is all case sensitive
The basic layout is:
"ID","Attribute","Value"
Again this is kept simple, in the demo, I have a couple of extra fields, load the data from wherever is convenient. Consider how changeable the data is, you need to refresh the query to update the tooltips.
Data Wrangling
To get the DataExtract table ready we add an attribute column in the correct format for the substitution function to work:
#"Added Custom" = Table.AddColumn(#"Promoted Headers", "Attribute", each "{" & [Field] & "}")
This adds the squiggly brackets to our attribute.
The aim of the data wrangling is to get an HTML tooltip for each row. We use the ID to do this and select one row for each ID.
Use add Custom Column to do this and a formula like this:
Table.SelectRows( DataExtract, each [Field] = "MP")
this generates some code that looks like this:
#"Added Custom" = Table.AddColumn(#"Renamed Columns", "Custom", each Table.SelectRows( DataExtract, each [Field] = "MP"))
Add Custom Column is your best buddy for data wrangling
In the example I grab the Electorate as well and put that into the HTML, creating another column
 #"Expanded Custom" = Table.ExpandTableColumn(#"Added Custom", "Custom", {"ID", "Electorate"}, {"ID", "Electorate"}),
 #"Added Custom1" = Table.AddColumn(#"Expanded Custom", "ReplacedHtml", each Text.Replace([HTML],"{Electorate}",[Electorate])),
This means our latest HTML is now in the Column "ReplacedHtml"
Having got the ID we then pick up a little table for each ID that has all the data for each tooltip. I use a function to do this:
(FilterValue as number) as table => Table.SelectRows( DataExtract, each [ID] = FilterValue)
This is in a separate function called FilterSelect that we invoke like this:
#"Invoked Custom Function" = Table.AddColumn(#"Added Custom1", "SubstituteTable", each FilterSelect([ID])),
This has the effect of adding a table column called "SubstituteTable".
Then we use the create another HTML column using the ReplaceAll function:
#"Invoked Custom Function1" = Table.AddColumn(#"Invoked Custom Function", "FinalHtml", each ReplaceAll([ReplacedHtml], [SubstituteTable]))
Which gives us the "FinalHtml' column that we will use in the tooltip. I'll talk more about the ReplaceAll function later.
You'll see in the video that we have to update the coordinates extract, this is just a matter of splitting the coordinates column into latitude and longitude, adjusting the sign on the latitude.
Let's move on to getting the visual aspects happening. You can review all the data wrangling in the video, where I go through it step by step.
Tooltip Visual
If you've got this far, the hard bit is behind us, this is fairly easy.
Take the page where you have the HTML Content Viewer and rename the page to Tooltip, or whatever you fancy, on the formatting pane set Page Information->Tooltip 'On'
Set the page size to 'Tooltip' or 'Custom', you need a size about 320X240, set the page view to 'Fit to Page; and ensure the Visual is fitting snugly.
At this point check the data model to make sure the tooltip data is mapping nicely using the ID to the CoordinatesExtract that we are going to use for the map.
You don't need all those columns in the TooltipData table, so you can remove the ones that you're not using after testing.
Add the Map to a new page and just add the Latitude and Longitude and check the tooltip. If all that is working fine the go to the Format Pane of the Map visual and make sure Tooltip is on, Type 'ReportPage' and select the Page as 'Tooltip' or whatever the tooltip page is called. This should enable your HTML content as a tooltip, so give it a test.
ReplaceAll
The replace all function is based on a function at https://www.howtoexcel.org/power-query/bulk-replace-values/, go there for an explanation of how it works.
I was concerned that the function used hard-coded column numbers to do the replace. I thought the way to solve this you be to get the column name and look for
the 'Attribute' and 'Value' names and find their positions
This is a function that does that:
let SelectColumns = (SubstituteTable as table ) =>
 let
 SubstituteTableSchema = Table.Schema(SubstituteTable),
 AttributeRow = Table.SelectRows(SubstituteTableSchema, each ([Name] = "Attribute")),
 Attribute = Table.SelectColumns(AttributeRow,{"Position"}){0}[Position],
 ValueRow = Table.SelectRows(SubstituteTableSchema, each ([Name] = "Value")),
 Value = Table.SelectColumns(ValueRow,{"Position"}){0}[Position],
 Output = [ Attribute=Attribute, Value=Value]
 in
 Output
in
 SelectColumns
Table.Schema is a powerful data wrangling function and this is the method used in the download example.
Summary
There are lots of other things you can do with the HTML Viewer, for this example, you can download the Power BI Tooltip Demo and the Data Extract and the Coordinates Extract